What is the purpose of a calibration curve, and how is it constructed?

The following stages are commonly included in the production of a calibration curve:
The process of creating standard solutions involves creating a number of solutions with known analyte (the material being analyzed) concentrations. The standard solution concentrations have to fall within the anticipated range of concentrations for the samples that will be analyzed.
Measurement of the response: Each standard solution’s response, such as its absorbance, mass, or voltage, is measured using a measuring equipment. Measurements are kept on file.
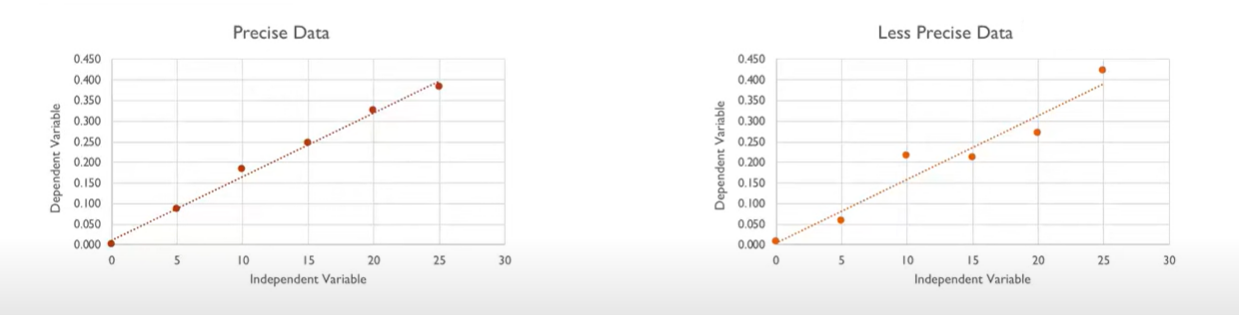
The data acquired in step 2 are displayed on a graph with the response on the y-axis and the concentration on the x-axis to create the calibration curve. The calibration curve is the name given to the resultant graph.
Analysis of the calibration curve: To establish the connection between the response and concentration, the calibration curve is evaluated. This might include fitting the data to a mathematical function, such a quadratic, cubic, or straight line polynomial.
The calibration curve may be used to determine the analyte concentration in unidentified samples after it has been established. Depending on where the unknown sample falls on the calibration curve’s range, the instrument’s reaction to the unknown sample is measured, and the concentration is projected or estimated from the calibration curve to arrive at the concentration.