How to Read a TCC Curve (Time Current Characteristic)?
A Time Current Characteristic (TCC) curve shows how quickly a protection relay trips at different fault current levels. It is one of the most important tools for understanding relay coordination, ensuring that the relay closest to the fault operates first while upstream relays provide backup protection. I use DIgSILENT PowerFactory to model and analyze these TCC curves for protection studies.
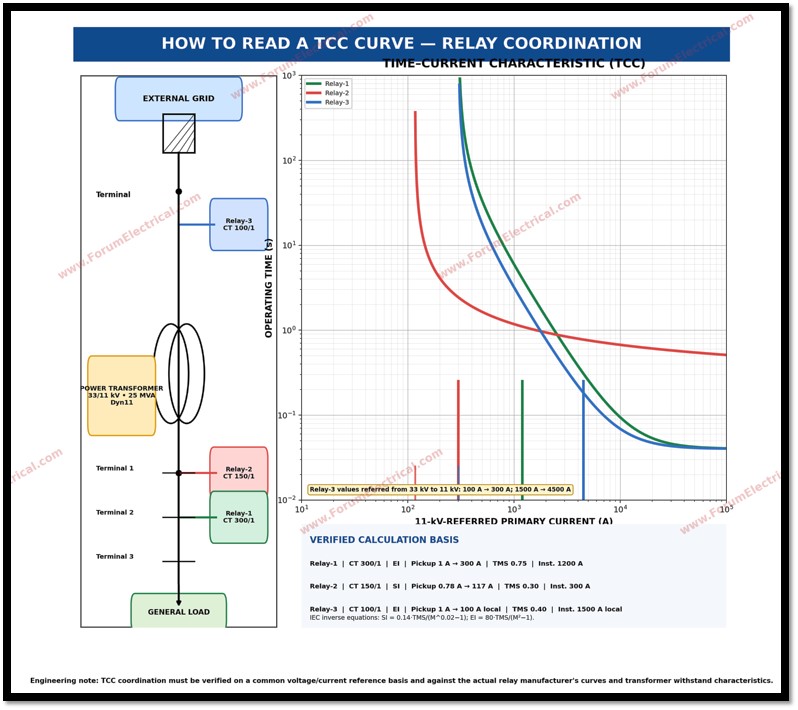
The X-axis represents current (A) on a logarithmic scale, while the Y-axis represents operating time (s). The key principle is simple: as fault current increases, the relay operates faster.
Three Main Types of Protection Characteristics
IDMT (Inverse Definite Minimum Time): The most commonly used overcurrent protection characteristic. Higher fault current results in faster tripping, so the TCC appears as a downward-sloping curve. Common variants include Standard Inverse, Very Inverse, and Extremely Inverse.
DMT (Definite Time): The relay trips after a fixed time delay regardless of the fault current magnitude. On the TCC, this appears as a horizontal line.
Instantaneous Protection: The relay operates immediately once the current exceeds its set value, with no intentional time delay. On the TCC, this appears as a vertical line.
Important TCC Parameters
The pickup current is the minimum current at which the relay begins operating. Below this value, the relay will not trip.
The Time Multiplier Setting (TMS) controls the operating speed of IDMT relays. A lower TMS produces faster tripping, while a higher TMS results in slower operation.
Relay Coordination
Proper relay coordination ensures that only the faulty section is isolated, minimizing disruption to the rest of the power system. The relay nearest the fault should trip first, while upstream relays remain available as backup.
If two relay curves overlap on the TCC, both relays may trip for the same fault. This overlapping curve condition is undesirable because it can cause nuisance tripping, where healthy sections of the system are disconnected unnecessarily.
Transformer Damage Curve and Grading Margin
A Transformer Damage Curve indicates the maximum current and duration that a transformer can safely withstand without damage. Protection relay curves should always remain below this limit during coordination studies.
To achieve selective tripping, engineers maintain a grading margin between relay operations, typically around 200 ms, ensuring the downstream relay clears the fault before the upstream relay operates.